

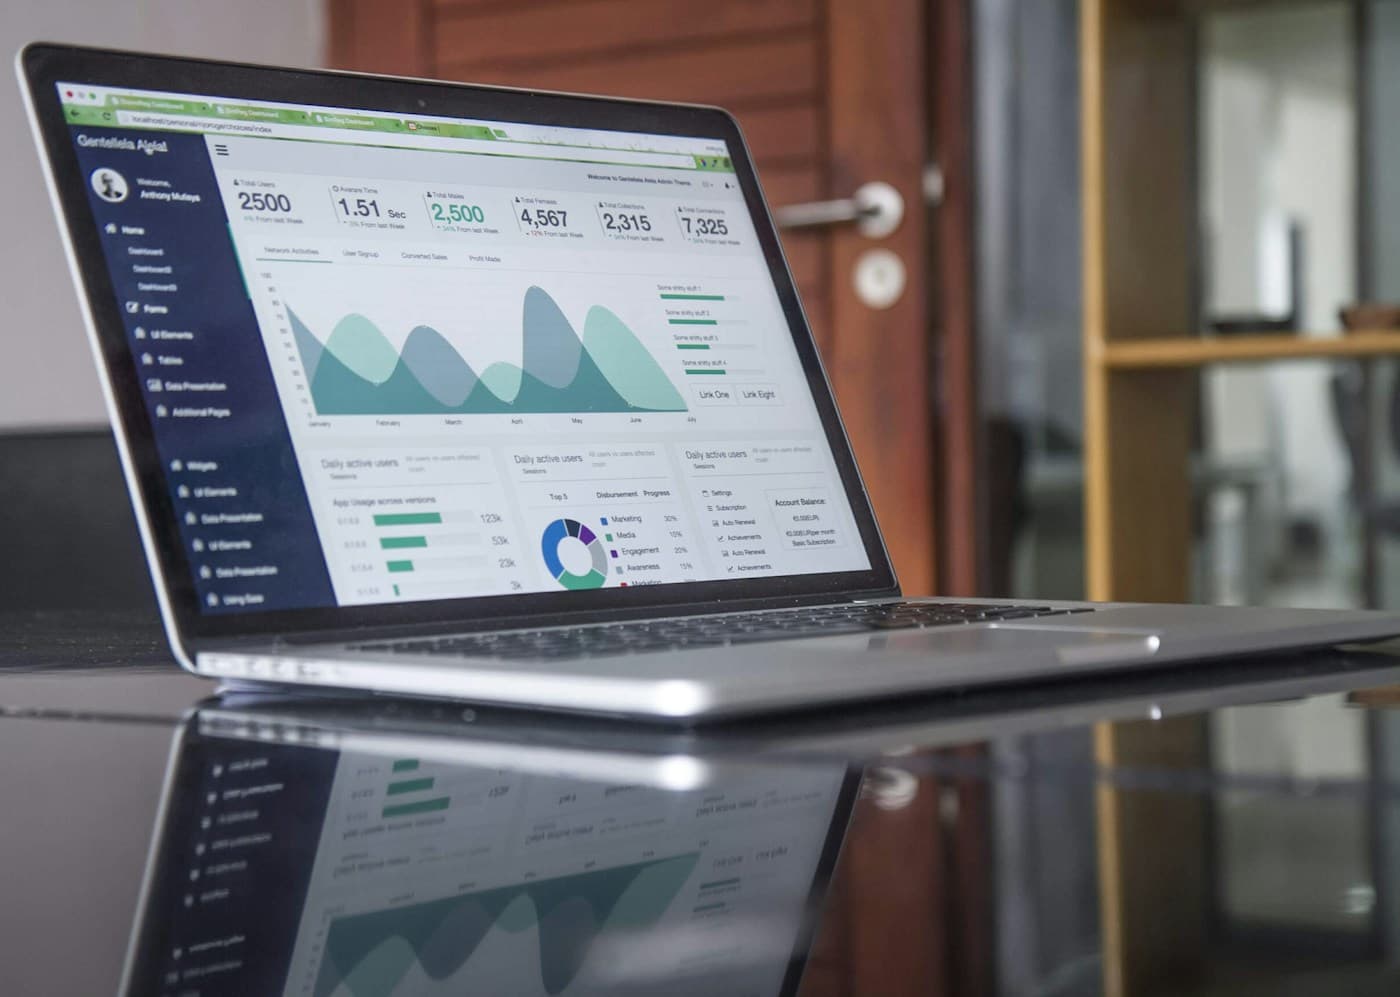
Most dashboards are built to show everything, which is why nobody opens them twice.
01 · The question as it arrives
“We need better visibility.” The request usually comes after a meeting where nobody could agree on a number.
The data exists, spread across the website, the CRM, the finance system and a few spreadsheets. Pulling it together takes someone half a day every month.
The proposal is a dashboard: one place, always up to date, that everyone can see.
02 · Why the obvious answer fails
A dashboard answers the questions it was built for. Built for every question, it answers none of them quickly.
Take a dashboard with forty charts across six tabs. It launches well and is opened in the first few meetings, then quietly falls out of use, because nobody knows which chart matters today.
The second problem is trust. When two systems disagree about a figure, the dashboard shows the disagreement faster. The first time a number looks wrong, people go back to their own spreadsheets.
The third is ownership. Nobody is responsible for acting on what it shows, so a warning sign can sit on screen for weeks.
03 · What we look at instead
The decisions it should support. A short list of recurring decisions, who makes them and how often. Each chart should earn its place against one of them.
The few numbers that drive them. Usually a handful, each with an agreed definition and a single source.
What happens when a number moves. Who is told, what they are expected to do, and by when.
The objection is that a smaller dashboard shows less. It does. It also gets used, which is the only way a dashboard pays for itself.
04 · Where to start
Start by listing the three decisions your team makes most often that data should inform.
For each, agree the one or two numbers that matter, how they are defined and which system is the source of truth.
Build a single page around those numbers first, and use it in real meetings for a month before adding anything else.
Name an owner for each number, so that when it moves, someone is expected to act.